On Monday at 9 a.m. Eastern time, XRP is trading at $2.99 to $3.00, up 3.9% in the past 24 hours, with a market capitalization of $177.31 billion. The cryptocurrency has posted a 24-hour trading volume of $4.85 billion and traded within an intraday range of $2.86 to $3.02, showing signs of consolidation after recent volatility.
 Jamie Redman
XRP
On the 1-hour chart, XRP has been on a steady climb from $2.77 to $3.03, currently consolidating just below the $3.05 resistance level. A volume spike at $3.03 led to rejection, confirming this area as a key short-term hurdle. Immediate support is noted at $2.98, making it a critical level for bulls to defend. A breakout above $3.05 with sufficient volume could open the door for a push toward $3.10$3.15, while a breakdown under $2.98 could shift momentum toward $2.93$2.90.
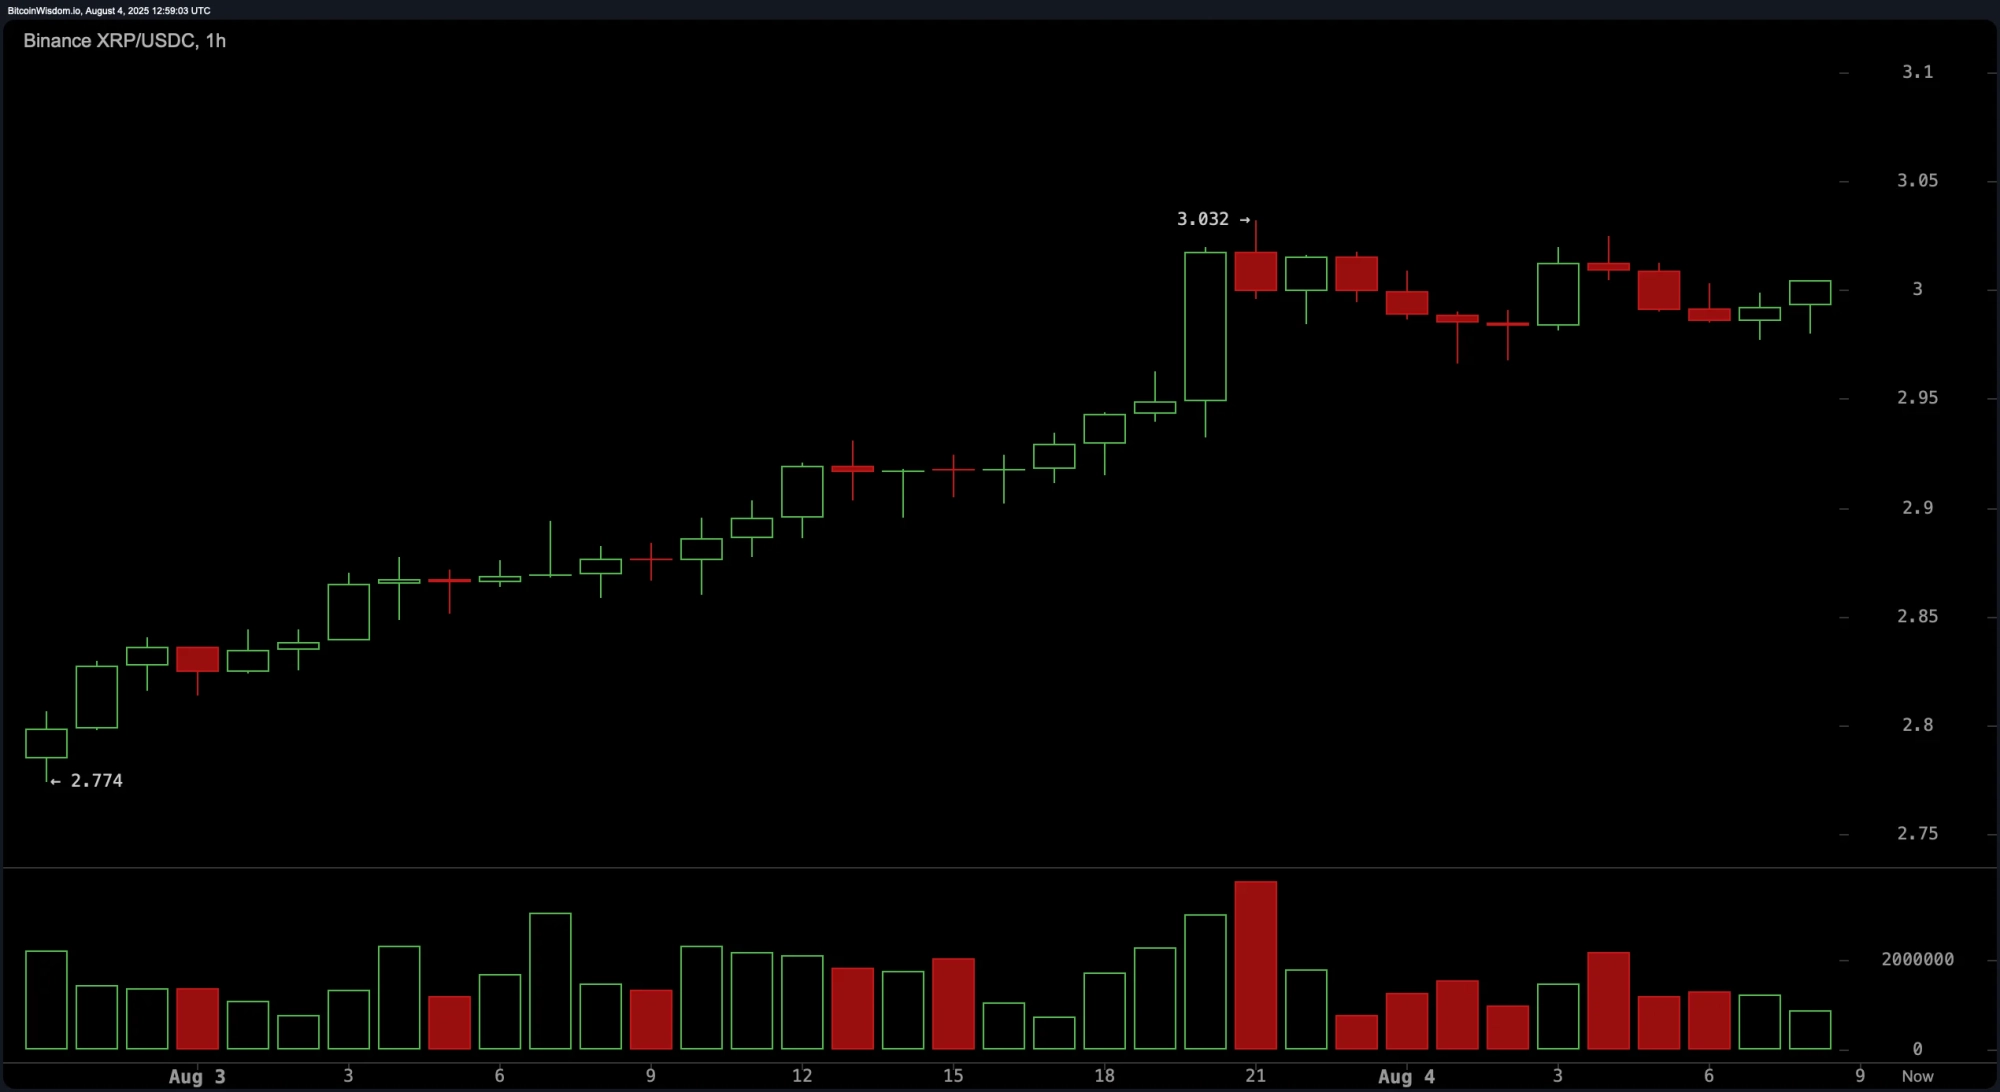 XRP/USDC via Binance 1-hour chart on Aug. 4, 2025.
The 4-hour chart depicts a recovery from the $2.72 low back to the $3.00 region after a preceding downtrend from $3.17. The pattern now shows higher highs and higher lows, reflecting a tentative bullish structure. Short-term resistance lies at $3.05, while support at $2.90 is essential for maintaining upward momentum. Buying volume during the recovery is noticeable but remains weaker than the selling surge observed on August 2, signaling caution for traders.
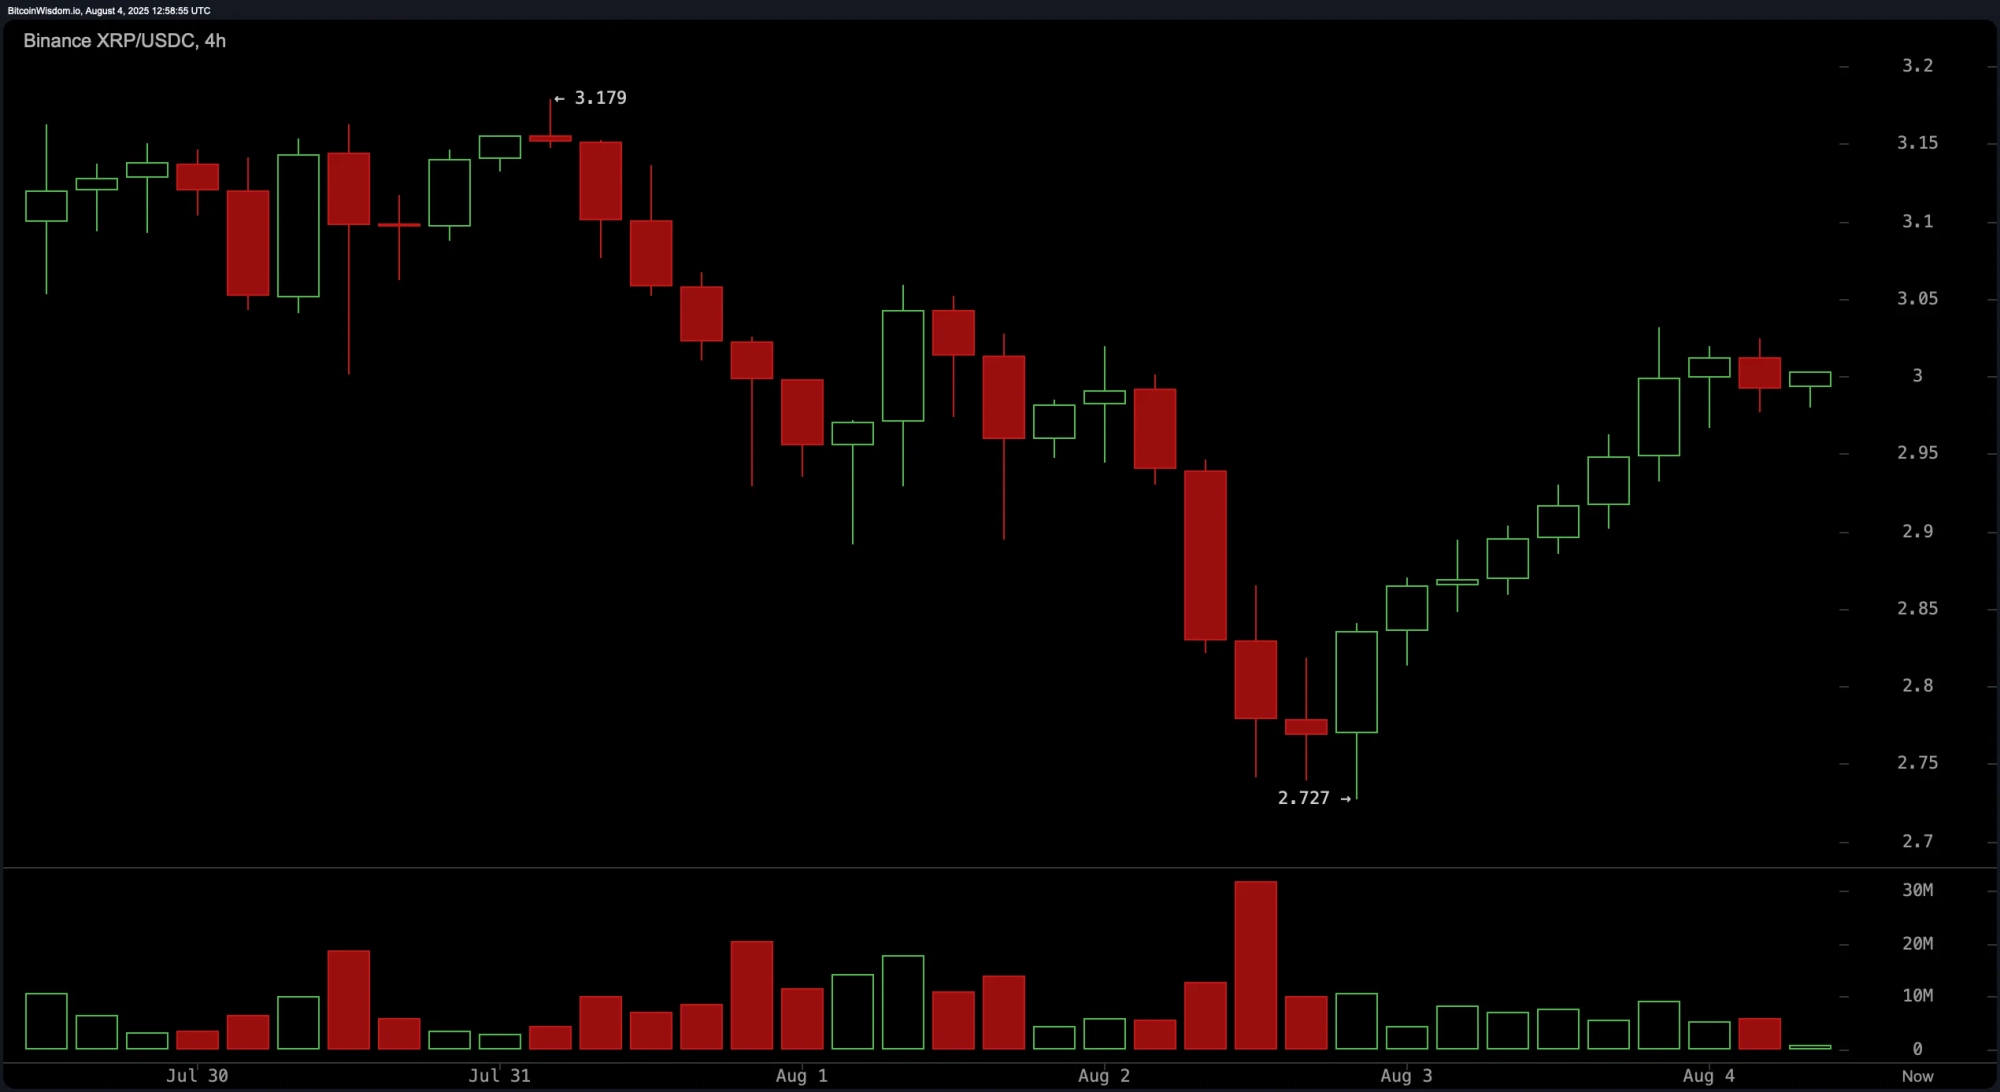 XRP/USDC via Binance 4-hour chart on Aug. 4, 2025.
From the daily chart perspective, XRP remains in a macro uptrend that began with a surge from $2.15 to $3.66 before entering a corrective phase. The price is currently consolidating between $2.80 and $3.05 after a pullback from recent highs. Strong selling volume accompanied the drop from $3.66, while support at $2.80 continues to hold. A breakout above $3.20 with strong volume could reignite the uptrend toward $3.40$3.66, but a fall below $2.80 could trigger declines toward $2.60.
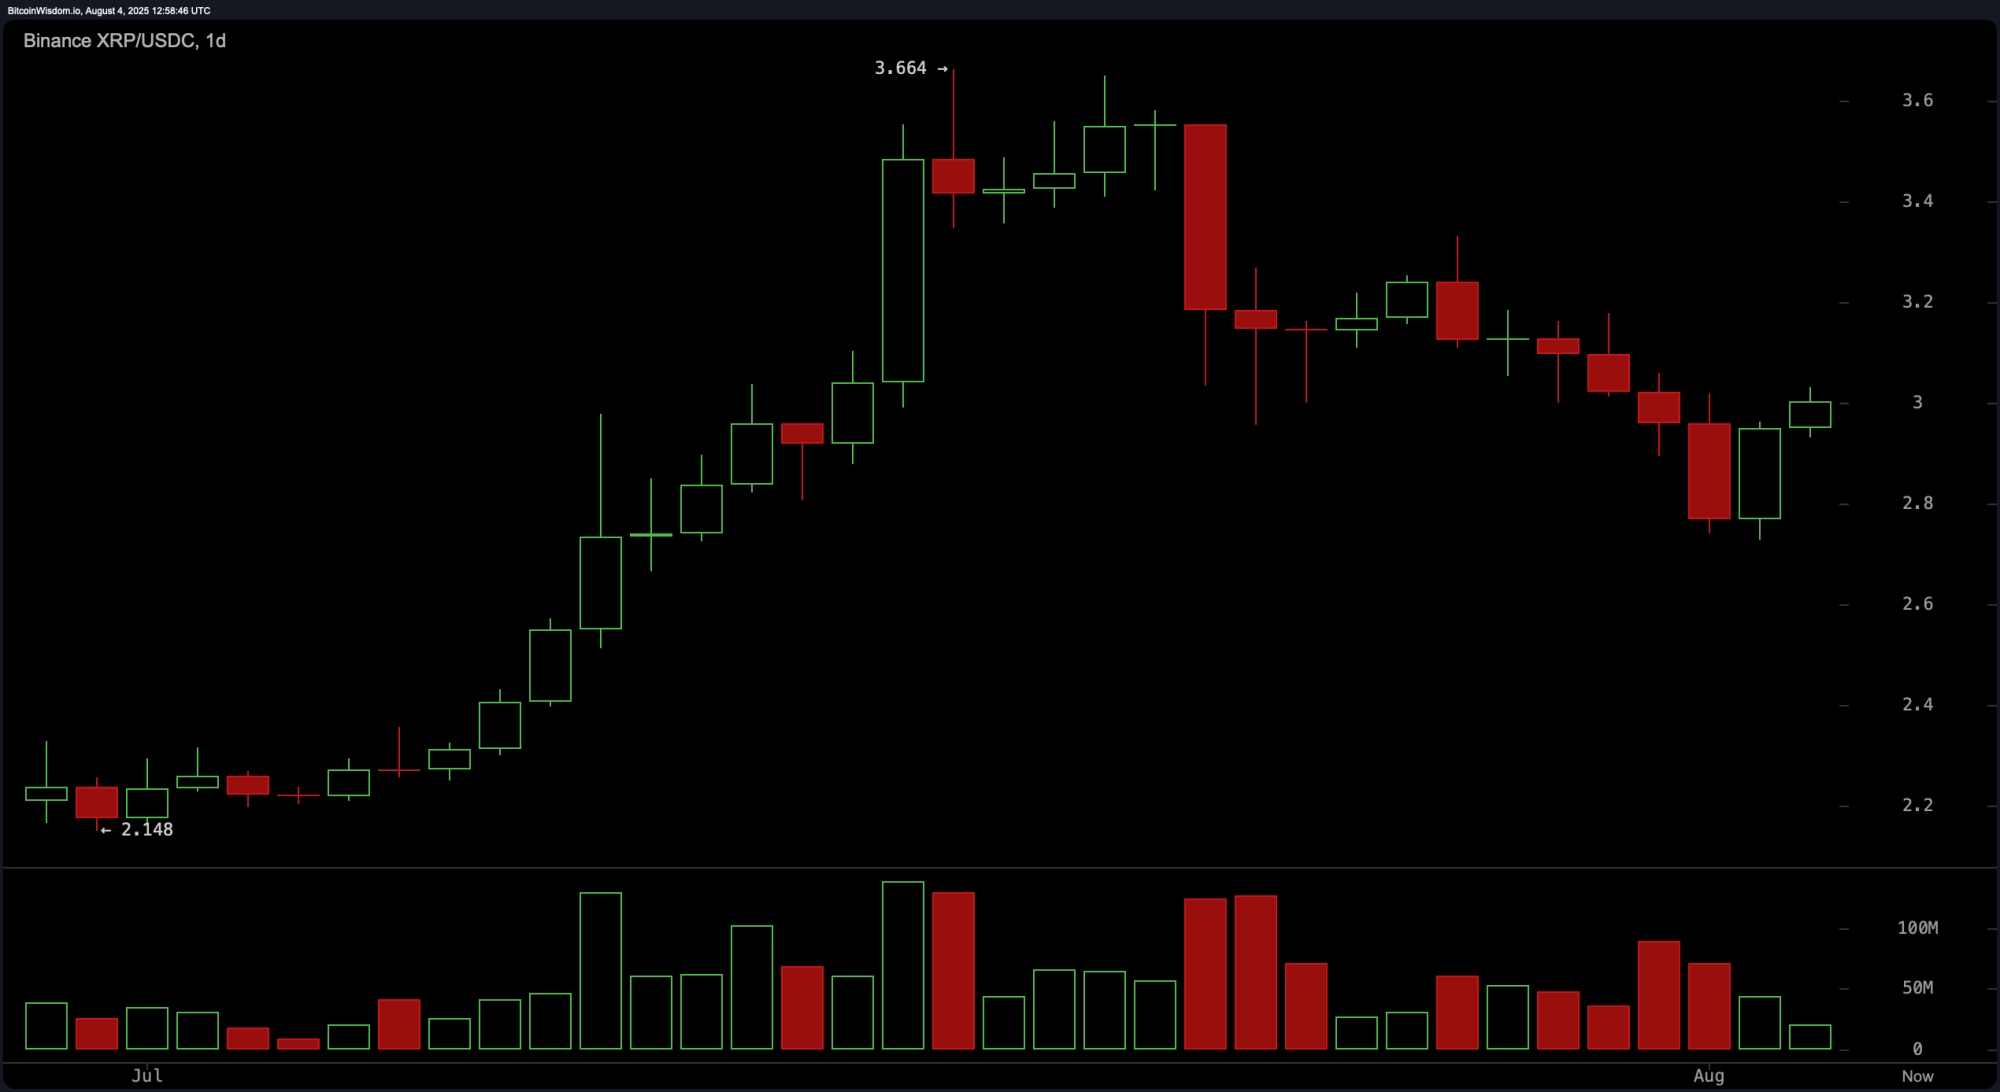 XRP/USDC via Binance 1-day chart on Aug. 4, 2025.
Oscillator readings indicate a largely neutral market stance. The relative strength index (RSI) at 51.37 is neutral, as are the Stochastic oscillator at 19.53, the commodity channel index (CCI) at 77.91, the average directional index (ADX) at 34.20, and the Awesome oscillator (AO) at 0.05791. Momentum at 0.14546 suggests a positive signal on the daily chart, while the moving average convergence divergence (MACD) level at 0.05962 points to bearish sentiment. This mixed oscillator profile implies a market in equilibrium, awaiting a catalyst for directional clarity.
Moving averages (MAs) show a blend of bearish short-term signals and bullish longer-term trends. The exponential moving average (EMA) and simple moving average (SMA) over 10 and 20 periods both indicate negative trend signals, with EMA (10) at $3.02302 and SMA (10) at $3.04472. However, the EMA (30) at $2.94150 and SMA (30) at $2.99480 suggest buying pressure, as do the EMA (50) at $2.79232, SMA (50) at $2.66601, EMA (100) at $2.58549, SMA (100) at $2.47274, EMA (200) at $2.34144, and SMA (200) at $2.45413. This divergence points to short-term resistance, but further highlights solid support from medium to long-term holders.
Bull Verdict:
If XRP can maintain support above $2.98 on the 1-hour chart and break decisively above $3.05 with strong volume, the path toward $3.10$3.15 in the short term becomes viable. A follow-through move could set the stage for a test of $3.20, and if that level is breached on the daily chart, bulls could aim for $3.40$3.66 in the coming weeks.
Bear Verdict:
Failure to hold $2.98 on the 1-hour chart could invite selling pressure toward $2.93$2.90, with a deeper drop possible toward $2.85. A breakdown below the daily chart support at $2.80 would signal renewed bearish momentum, opening the door for a decline toward $2.60 and invalidating the recent bullish recovery pattern.