- XRP broke above $3.07 following a $58.6 million whale transfer from Upbit to an unknown wallet
- Exchange outflows hit 29.38 million XRP in 24 hours, suggesting long-term accumulation behavior
- Short positions worth $75.65 million are stacked near $3.10-$3.13, creating potential squeeze conditions
- Technical analysis shows bullish breakout pattern with $3.30 as next key resistance target
- Whale-to-exchange flows have declined even as price climbed, indicating reduced selling pressure
XRP experienced renewed buying interest following a major whale transaction worth $58.6 million on August 5th. The transfer involved 20 million XRP tokens moving from Upbit exchange to an unknown wallet.
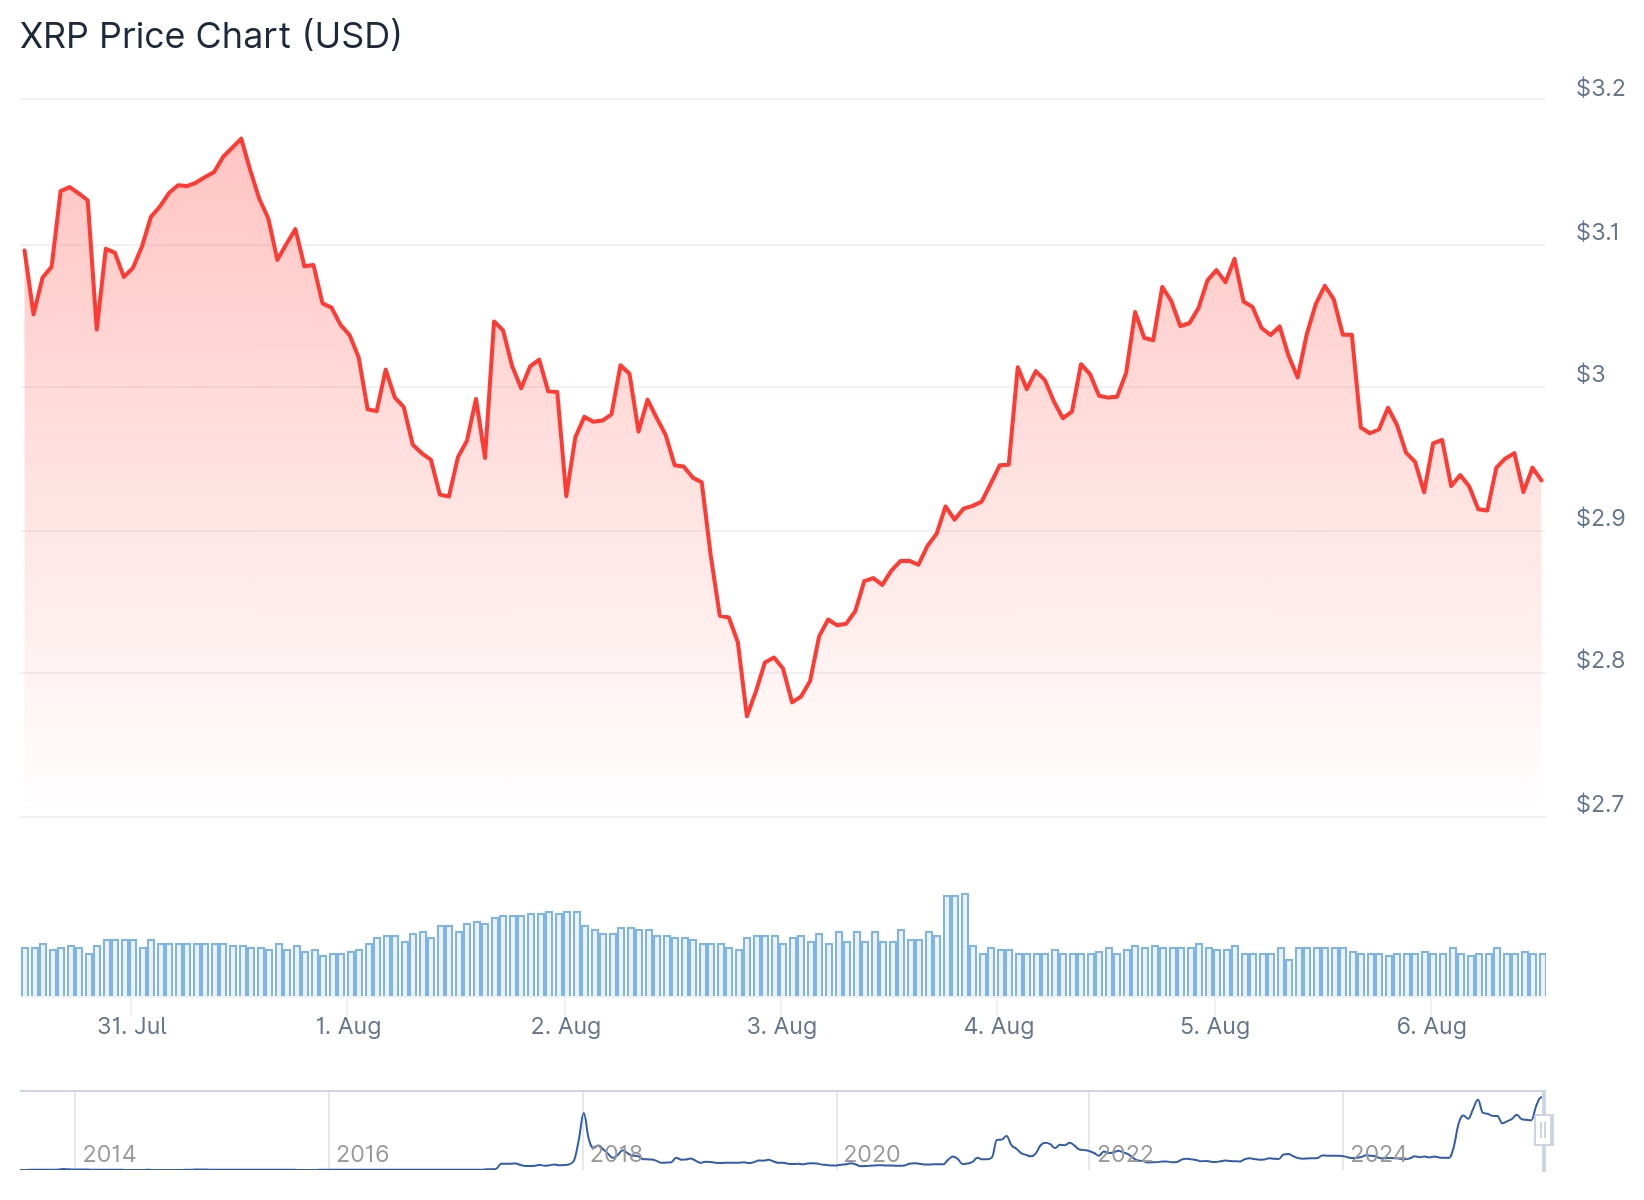 XRP Price
This whale activity coincided with broader market movements suggesting accumulation. Spot exchanges recorded net outflows of 29.38 million XRP over 24 hours.
Exchange outflows typically indicate investors are moving tokens to cold storage for long-term holding. This pattern often precedes price increases as available supply on exchanges decreases.
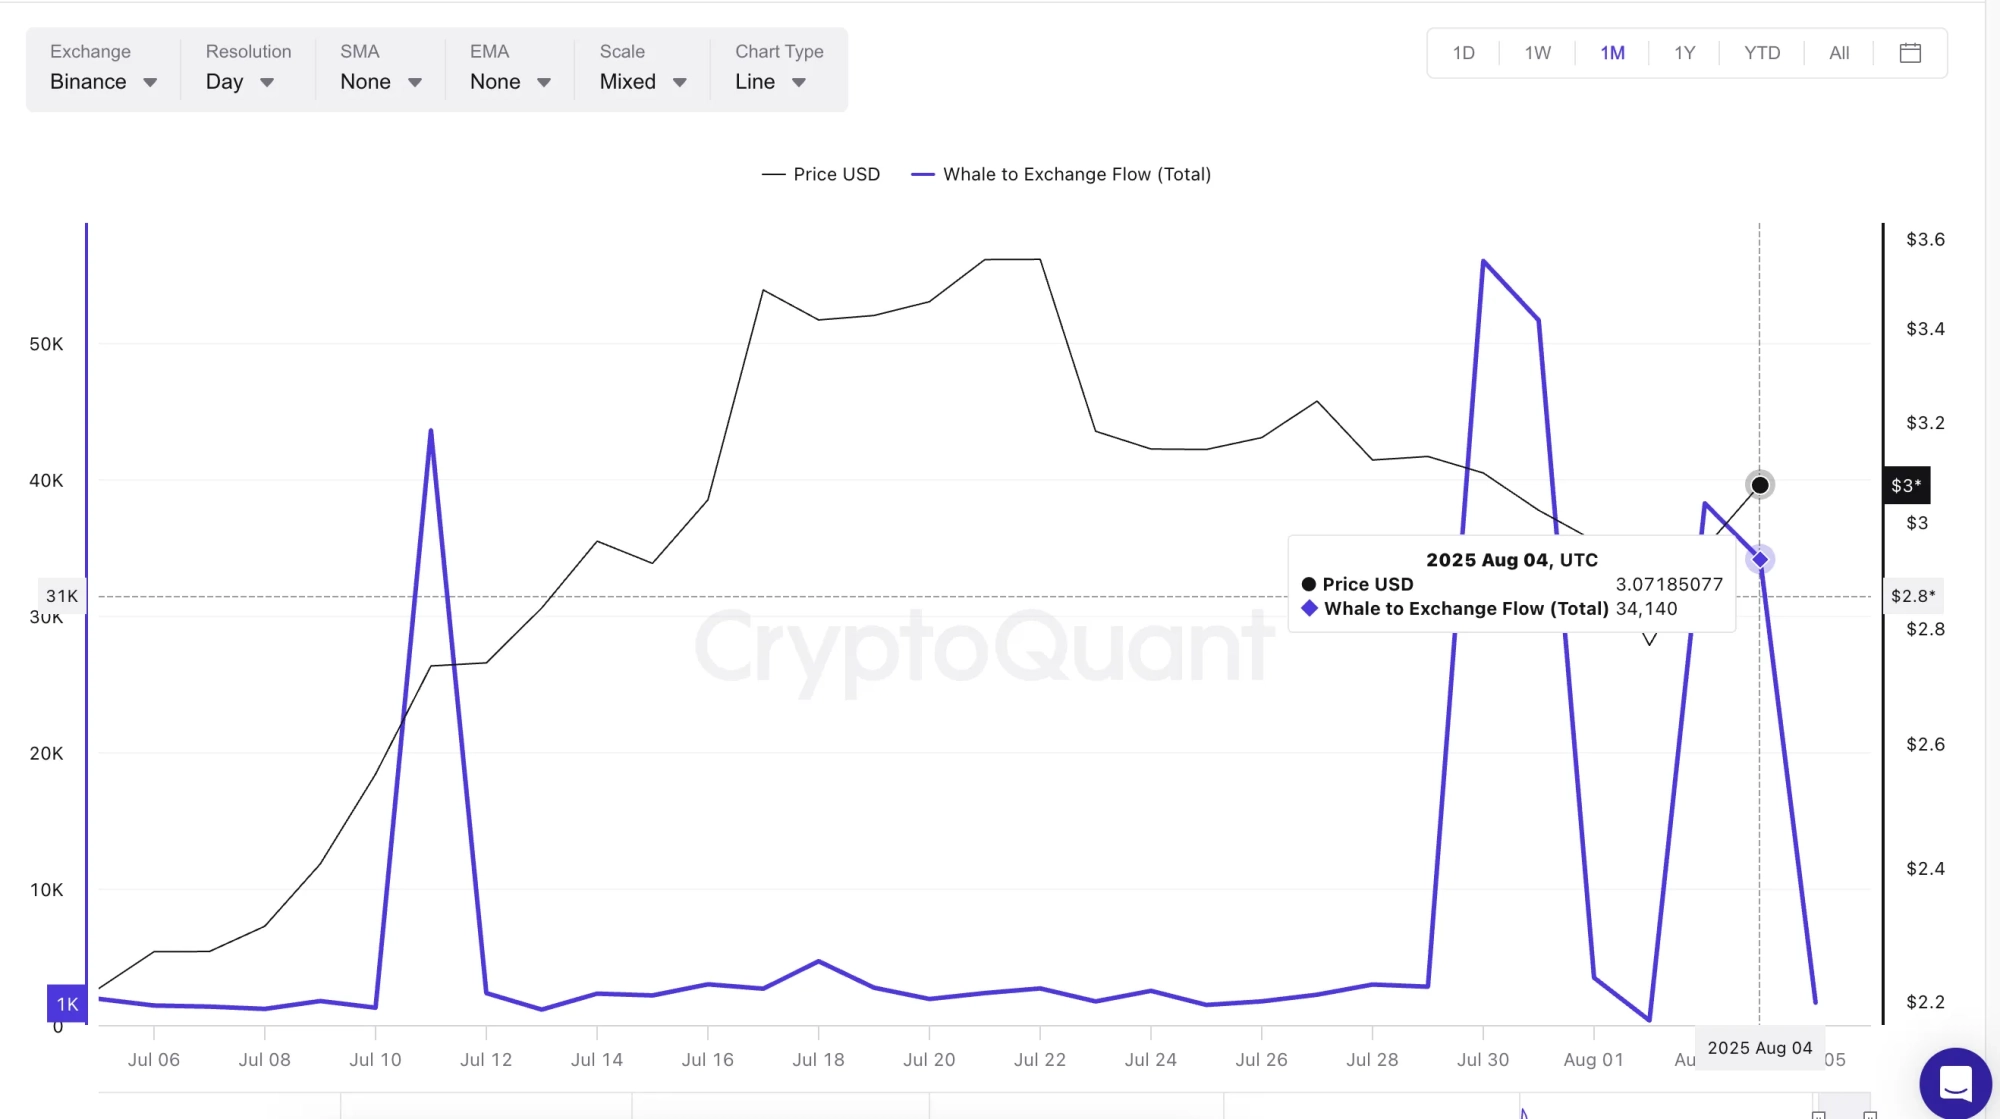 Source: CryptoQuant
The price action has created an interesting dynamic in the derivatives market. Short liquidations are heavily concentrated near $3.113, totaling $75.65 million in positions.
Meanwhile, long positions worth $42.85 million sit near $2.97. This creates potential for rapid price movements in either direction if volatility increases.
Technical Breakout Pattern Emerges
XRP broke through key resistance levels during recent trading sessions. The token successfully escaped a falling broadening wedge pattern on technical charts.
This breakout triggered a bullish Supertrend signal on four-hour timeframes. XRP now trades above this technical indicator, suggesting momentum has shifted in favor of buyers.

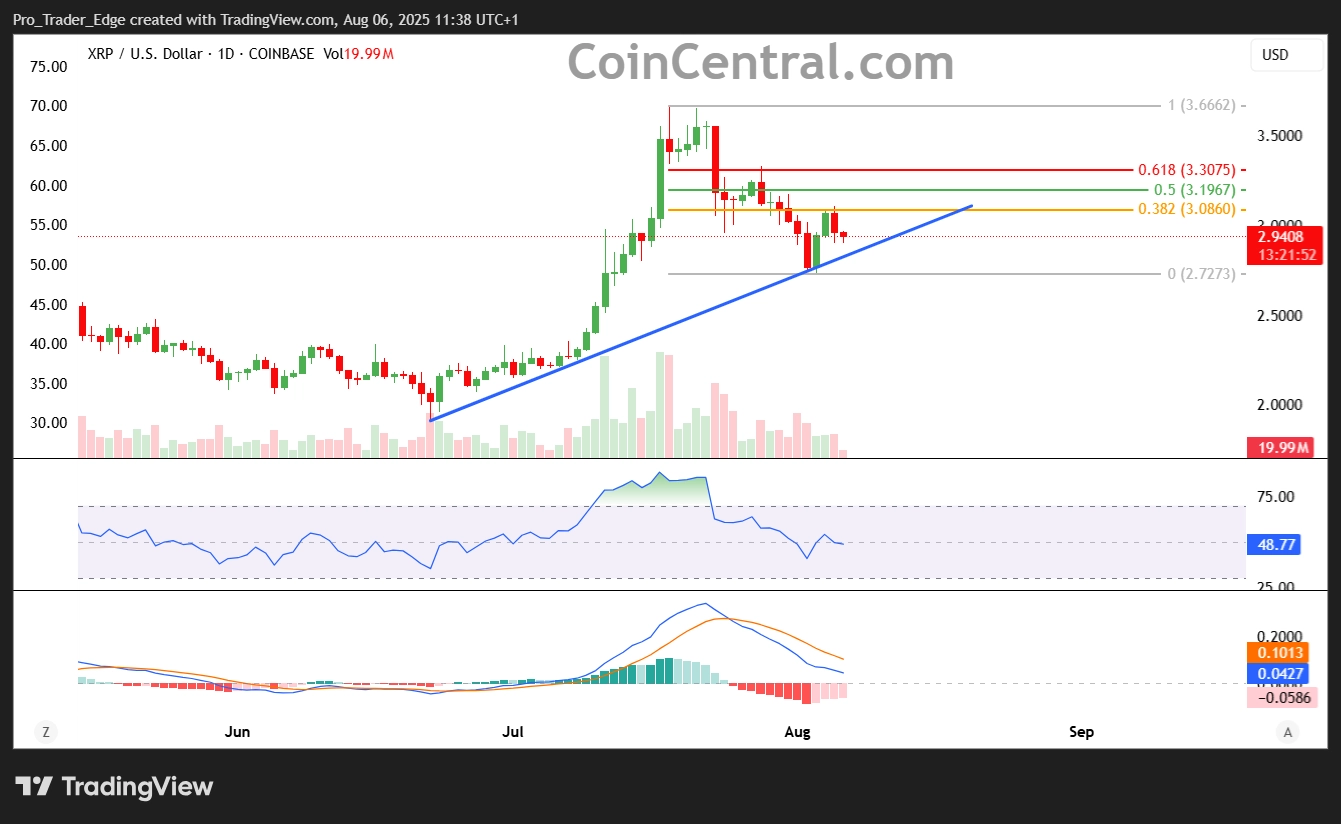 Source: TradingView
The current price structure shows XRP retesting the breakout level around $3.00. If this support holds, technical analysis points to a potential 10% rally toward $3.30.
The $3.30 level represents both a Fibonacci retracement target and the upper boundary of the current trading range. This zone also aligns with the heaviest concentration of short liquidations.
Whale Behavior Shows Divergence
Recent whale-to-exchange flow data reveals changing behavior patterns among large holders. Previous rallies saw aggressive whale selling as prices approached resistance levels.
On July 30, whale inflows spiked to over 55,000 XRP when prices dipped below $3.00. Similar spikes occurred on August 3 as the token approached the same level.
However, whale flows have since declined to 34,140 XRP on August 4 despite prices remaining above $3.00. This divergence suggests reduced selling pressure from large holders.
The liquidation map from Bitget shows an imbalance favoring short positions. Shorts total $1.6 billion while long positions stand at just $784 million.
This setup creates conditions for a potential short squeeze if XRP can break above $3.08-$3.30. A 10-14% upward move could trigger cascading liquidations.
XRP currently trades at $3.06, representing a 0.79% increase over 24 hours. Trading volume remains relatively flat, indicating market indecision before the next major move.
The token maintains a 35% monthly gain despite losing over 5.3% in the past week. This performance places XRP at a critical juncture heading into August.
Historical data shows August tends to be a volatile month for XRP trading. The current price position near $3.00 makes this level particularly important for future direction.
Exchange inflows have begun rising again since July 30, when prices first approached $3.00. This pattern mirrors behavior seen on July 11, when inflows surged over 220 million XRP.
During that previous episode, prices initially climbed past $3.60 before selling pressure eventually caught up. The delay suggests traders positioned for exits without immediately executing sales.
A sustained move above $3.45 would represent a more decisive breakout according to technical analysis. This level would clear all current short positions shown on the Bitget liquidation chart.
Failure to hold above $3.00 could invalidate the current bullish setup, potentially leading to a test of support near $2.72.