Birdeye is a real-time crypto data aggregator that lets Solana traders monitor new token launches, liquidity pools, wallet activity, and more.
It pulls on-chain data from DEXes and AMMs so you can make informed decisions. In this guide, well walk through Birdeyes interface and tools for Solana analysis, with step-by-step instructions and examples.
1. Track New Solana Token Launches
Select the Solana chain: Go to birdeye.so and choose Solana from the chain menu (top-left).
Open Launch Explorer: Click Launch Explorer to open. This shows all tokens launched on Solana. By default it lists tokens by market cap, but you can switch to New tokens to see the latest listings.
Review token data: The Launch Explorer table shows each new tokens metrics: Market Cap, Liquidity, 24h Volume, 24h Transactions, 24h Traders, Holders, and even current price as well. Click on a token name to see its detail page. Large volume spikes or sudden liquidity can signal a hot launch. Sorting by Age or Volume helps spot the freshest or most active listings.
2. Monitor Token Holders and Wallet Behavior
See holder counts: On any tokens detail page, Birdeye displays the number of wallets holding that token (the Holders count) and the top-10 holders list. This helps gauge distribution, for example, a token with few holders (or one wallet owning most supply) is riskier. Birdeyes APIs can even fetch the full top-10,000 holders list for a token.
Analyze wallet transactions: Use the Find Trades tool to inspect any wallets activity. Go to Explore/� Find Trades. In the filters, set Traders � Wallet, then paste a Solana wallet address. Birdeye will list that wallets recent swap transactions (time, type, price, amount, DEX) over the last 90 days. This lets you see how whales or specific traders are buying/selling the token.
3. View Trading Pairs and Liquidity Pools
Birdeye shows every DEX liquidity pool (market) for a token.
Token Markets section: On a tokens page, scroll to the Markets or All Pairs section. Each row is a trading pair (e.g. RAY/SOL on Raydium for Raydiums RAY token). Columns list Liquidity ie. LP size, Market Cap, and recent activity (30m, 1h, 4h and even 24h volume and trades as well). This tells you which pools are largest and most active.
Example: Birdeye lets you select pair charts via its chart tool. For instance, the chart builder shows RAY vs SOL as the selected pair. (See figure below) Birdeye will then display liquidity, volume and price for the RAY/SOL pool in the Markets section. You can sort pairs by liquidity or volume to find the healthiest pools.
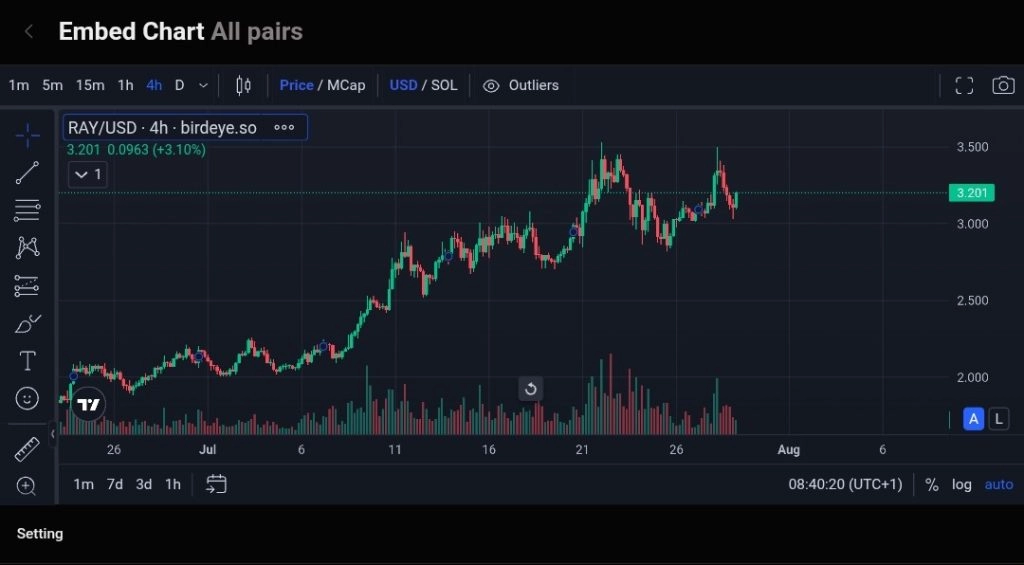
Figure: Birdeyes chart builder selecting Raydium (RAY) vs Solana (SOL) as a pair.
Interpreting LP data: A pools liquidity number is the total value locked (in USD). High liquidity means you can trade large amounts with low slippage. Birdeye also shows Circulating Supply and Max Supply on the token page (from the snippet above) so you can compare supply vs liquidity. If liquidity is very low relative to market cap, selling may be hard.
4. Check LP Health and Token Liquidity
Birdeye helps assess risk in a tokens pools:
Locked vs Burned Liquidity: Under the Security tab on each token page, Birdeye runs checks on the tokens smart contracts. It reports if any liquidity has been burned (permanently removed) or locked (restricted by time locks). Burned or locked LP adds safety, since those funds cant be rug-pulled.
Number of LP Providers: The Security Check also shows the LP Holders Count (how many wallets have provided liquidity). More LP providers means liquidity is more distributed healthier. One provider controlling the pool is riskier.
Holder Concentration: Birdeye flags if top holders control a large share of supply. The Top Holders Percentage criterion alerts you if the top 10 wallets own too much. Tokens with very high top-10 concentration can see big price swings if a whale sells.
Liquidity vs Market Cap: On the main token page, compare Liquidity vs Market Cap. If liquidity is a small fraction of market cap, the pool is shallow. Birdeyes data and warnings help you spot under-collateralized tokens (for example, a token with billions of market cap but only a few thousand in liquidity would be flagged). Always check that a tokens liquidity is healthy enough before trading.
5. Track Price Movements and Market Trends
Interactive price charts: Each token page has an Embed Chart showing its price and volume history. You can switch timeframes (e.g. 1H, 24H, 7D or even 1M) to analyze trends. Watch for patterns like sustained uptrends or sudden spikes.
Trending tokens and insights: Birdeyes main dashboard highlights market movers. The Token Trending or Find Gems sections list top gainers and highest-volume tokens over various periods. For example, the Find Gems widgets show tokens with highest 24h volume or largest price jumps. These dynamic lists help you spot emerging trends in Solana markets at a glance.
6. Birdeye Telegram Bots for Alerts and Tracking
Birdeye offers several bots for real-time alerts:
Birdeye Price Bot: Add the @birdeyePriceBot on Telegram. In a group, this bot can post real-time price, volume, liquidity and holder count for a chosen token. To set it up, add it to your Telegram group and give it Admin rights, then use /setgrouptoken (as shown in the docs) to specify the token. Once set, any user can type /price to get an update. In private chat you can also set alerts (e.g. notify me if price > $X).
New Pairs Bot: Birdeyes New Pairs Telegram channel automatically posts whenever a new token pair is listed on Solana. Join the channel to get instant alerts on fresh launches across Solana DEXes.
These bots ensure you receive live updates without constantly checking the site.
7. Birdeye APIs for Custom Analytics
For advanced users and developers, Birdeye provides a full API and WebSocket feed:
WebSocket subscriptions: You can subscribe to real-time events. For example, the SUBSCRIBE_TOKEN_NEW_LISTING event pushes data immediately when a new token is listed. Similarly, SUBSCRIBE_WALLET_TXS lets you track transactions of a specific wallet address. This is useful to program your own alert system for new launches or whale moves.
REST API endpoints: Birdeyes REST API lets you query data on demand. Endpoints include fetching token details, prices, trade history, and holder lists. For example, the Token Holder List endpoint returns the top 10,000 holders of any token. The API also offers price, volume, and liquidity endpoints (see docs). These APIs can be integrated into custom dashboards or trading bots. See Birdeyes API docs for details on authentication and usage.
Using these APIs, you could automate analysis (e.g. alert when a tokens liquidity changes or a whale moves tokens) and integrate Birdeye data into your own tools.
In summary, Birdeyes Solana tools help you discover new tokens, examine who holds them, inspect liquidity pools, and follow market trends, all backed by on-chain data. By combining the dashboard features (Launch Explorer, token pages, charts) with alerts (Telegram bots) and data feeds (APIs), you can make much smarter Solana trading decisions. Birdeyes security indicators and real-time data ensure you spot risks like thin liquidity or whale concentration before diving in.
Sources: Birdeye documentation and UI birdeye.so.
Disclosure: This is not trading or investment advice. Always do your research before buying any cryptocurrency or investing in any services.
Follow us on Twitter @nulltxnews to stay updated with the latest Crypto, NFT, AI, Cybersecurity, Distributed Computing, and Metaverse news !