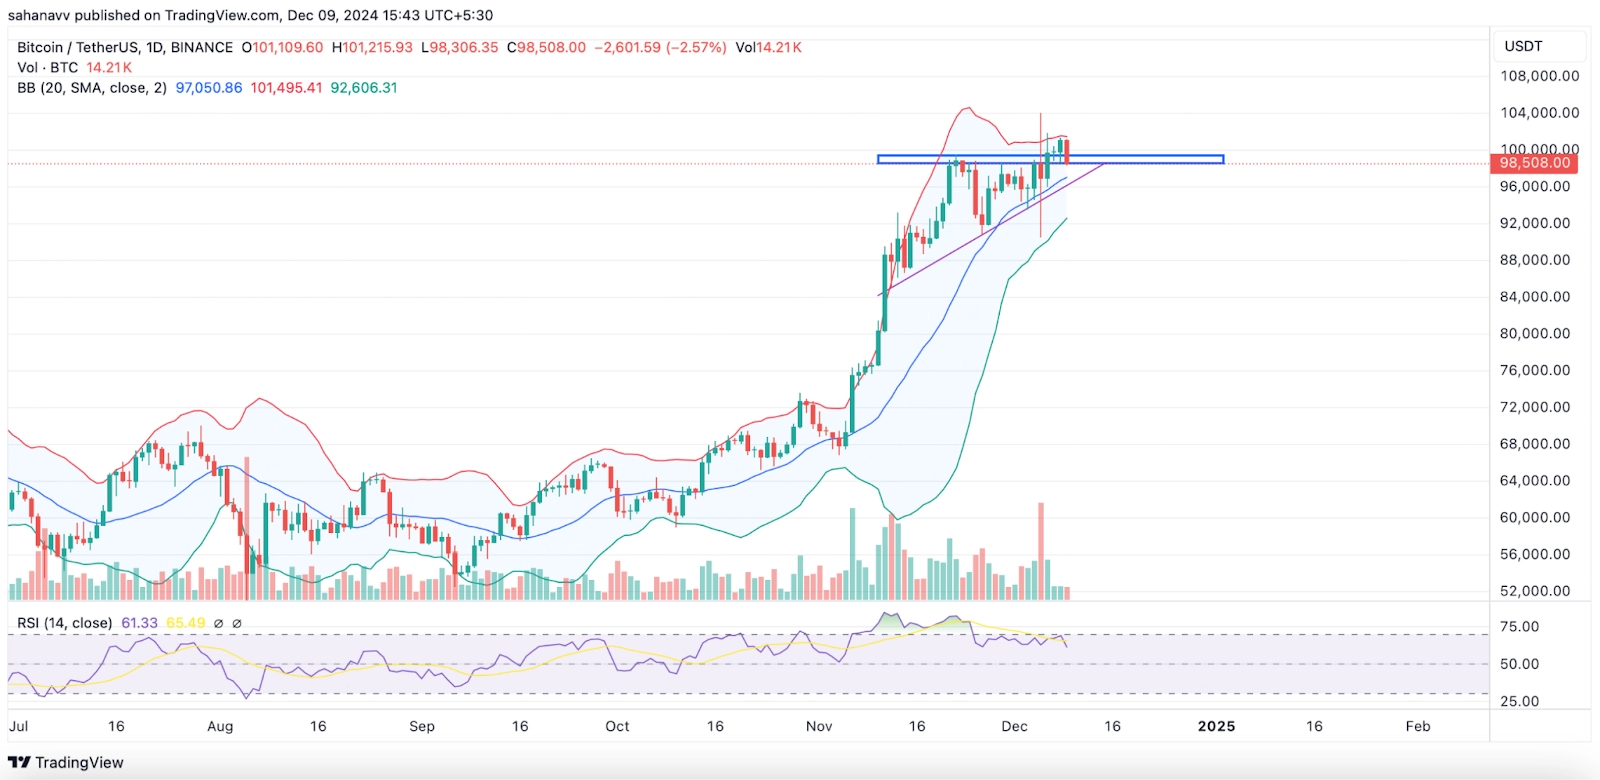
Ever since the Bitcoin price smashed a new ATH above $104K, the token has been failing to sustain the gains. The star token has been constantly testing the highs above $100K but is closing the day’s trade below the range. This could have raised the uncertainty over the token and, as a result, the selling pressure has been rising since the early trading hours. A leading indicator has just turned bearish and a continuation towards the lower targets may delay the bullish continuation for a while.
The recent price action suggests a drop in the bullish strength as the buying volume also fades. Does this indicate the end of the Bitcoin bull run is close enough? Is the token in the last phase of the bullish cycle?
The BTC price has been trading sideways over the past few days and is unable to sustain the price above the pivotal range. After a breakout from the range, the price is testing the resistance-turned-support zone. While the possibility of a rebound after the ongoing retracement is pretty high, but only be if the token sustains above one of the pivotal support zones.

With a drop in the volume from the highs above $150 billion, the token’s volatility has also declined to a large extent. Besides, the bands of Bollinger are going parallel with each other, suggesting the price to maintain a sluggish behaviour for some more time as the altcoins are surging with a rise in their dominance. Secondly, the RSI has displayed a bearish divergence, which validates the bearish trajectory.
The short-term price action suggests a drop as the momentum forms lower highs while the price forms higher highs. Hence, even if the markets rally sideways for days or while being within the overbought zone, the caution of the local correction remains high. Therefore, the BTC price is feared to drop below the zone as the upward pressure escalates. Meanwhile, some on-chain readings support the bullish narrative, hinting towards a rebound shortly.

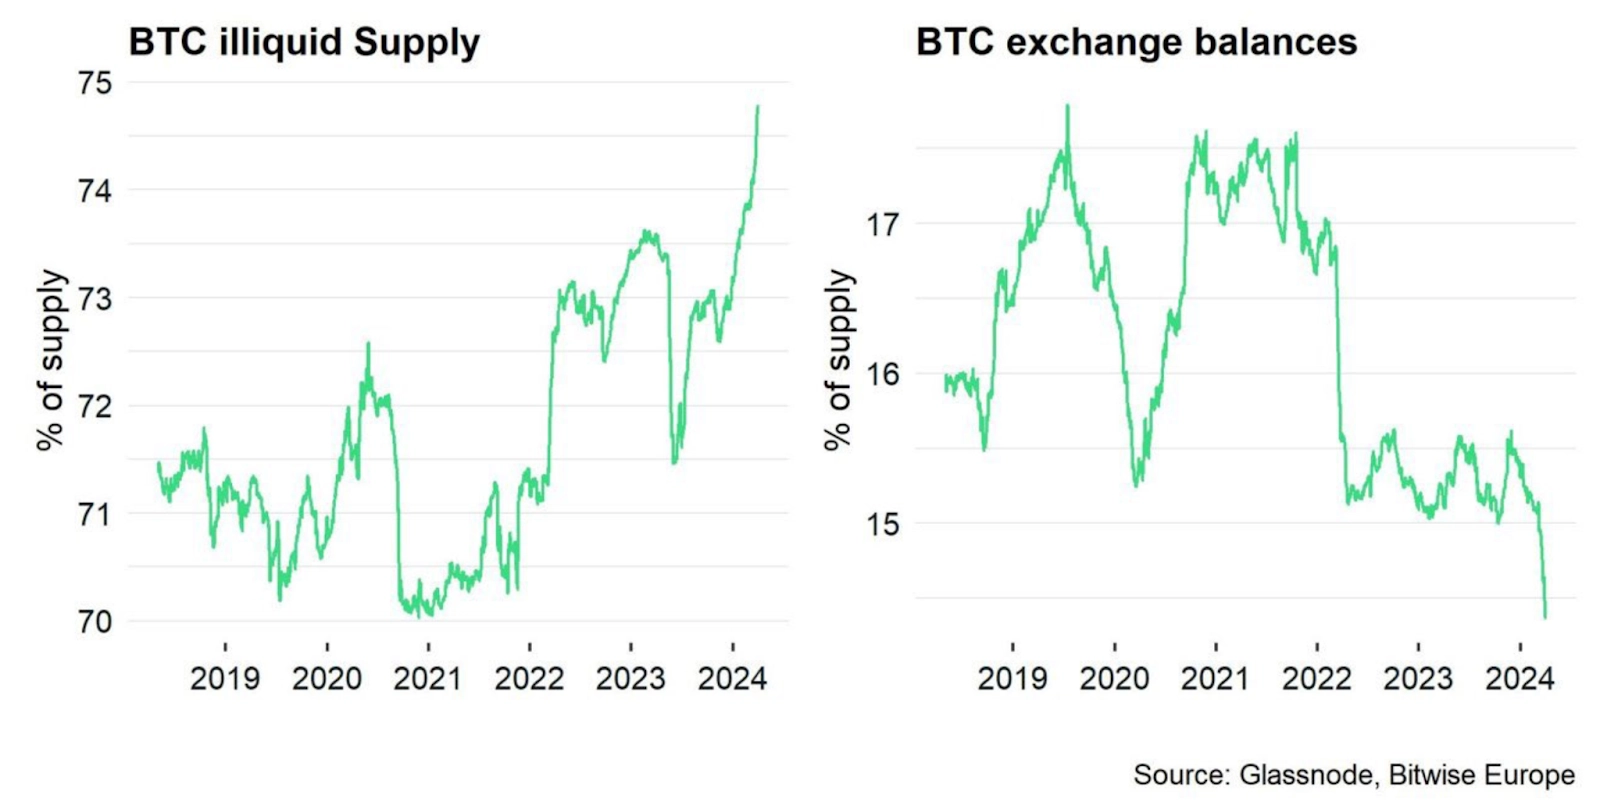
The above chart shows that the BTC illiquid supply is on the rise, meaning more Bitcoin is being held long-term while less is on exchanges. When demand increases, a limited supply on exchanges can drive the prices higher. Therefore, more exciting price action is expected for Bitcoin ahead of the yearly close but the drop in volatility may be a matter of concern at the moment.


